by Leah R. Rosenzweig, Development Innovation Lab, University of Chicago and Yang-Yang Zhou, University of British Columbia
As graduate students, we first met each other and became friends in Tanzania, working on our dissertations. We were conducting focus groups, collecting administrative data, and experimentally assessing programs. Because of these experiences working in the field, we understand and deeply appreciate the ability to be in-person learning and collecting data at our research sites. But a few years later in summer 2019, when we decided to start a new time-sensitive project together that required collecting public opinion data from Tanzania and Kenya, we couldn’t be there in person. So we planned and carried out the entire project remotely using Qualtrics as the survey platform; Facebook to recruit respondents online and communicate with them if issues arose (particularly around the follow-up endline); and Telerivet to send airtime as the survey incentive. We recently published this study, “Team and Nation: Sports, Nationalism, and Attitudes Toward Refugees” at Comparative Political Studies. While we conducted this study pre-COVID-19, we hope our experience can help researchers now who might have to do the same given travel restrictions or other limitations to in-person research that may arise for them.
Study Background
The research question driving our study was: how do major national events, such as a national sports team’s win, affect citizens’ national identification and attitudes towards foreigners, such as refugees? We were inspired by recent research which found that national sports team victories can lead to greater national identification, lower ethnic identification, and thus increased trust between conational out-group members. Yet, it remained an open question of whether this increased national identification might also lead to more exclusionary attitudes to non-nationals. And if so, whether certain messaging around the event could build positive feelings instead.
Indeed, we find for citizens, experiencing a national sports victory increases national pride and preferences for resource allocation toward conationals, but it also leads to negative views of refugees’ contribution to the country’s diversity. However, we also find that reframing the victory as a product of cooperation among diverse players and highlighting shared superordinate identities, like pan-Africanism, can offset these views and help foster positive attitudes toward refugees.
Panel Research Design
We designed our study as a natural experiment coupled with a survey experiment conducted using an online panel around the 2019 Africa Cup football (soccer) team match between two neighbors and football rivals, Kenya and Tanzania. Spanning June 21 to July 19 that summer, the Africa Cup of Nations is the continent’s premiere men’s football tournament. We knew that the “treatment,” Kenya playing Tanzania would be on June 27, and in order to measure change in citizen attitudes, we would need a baseline (pre-match) and follow-up endline (post-match) survey of the same respondents.
The June 27th match was a nail-biter: the match was tied until the final few minutes, when Kenya’s forward Michael Olunga scored the winning goal for a final score of 3-2. Thus, Kenyans would be considered “treated,” and Tanzanians were the “control” group.
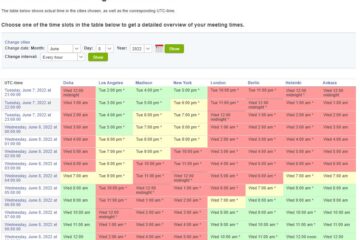
Our study timeline shows that our baseline survey started 14 days before the match, but because we wanted to lessen the interference of the two other matches in the group on June 23 and July 1 (with Algeria and Senegal), the bulk of our respondents got their baseline survey in the 3 days between June 23 and June 27 (green period). Then those respondents would receive the endline within 3 days after the match, while the earlier respondents (from the blue period) would get the endline later on (orange period). During the baseline, we set up quotas on Qualtrics to make sure we had the right number of respondents per day by period.

Facebook Recruitment

We created a Facebook page to post recruitment ads in English and Swahili (shown below) to adult users based in Kenya and Tanzania. We used Pexels to find free stock images to create our ads. Ads that featured images of people, instead of for example, a pen and paper, did better.
We spent approximately $2000 USD in total on ads. On average the ad cost per baseline survey was $0.22 in Kenya and $0.60 in Tanzania (more expensive for more rural areas), which is dramatically cheaper than the standard in-person surveys in these countries based on our experiences. We targeted ads to the entire country but we anticipated that most of our respondents would come from urban areas. Comparing our sample to recent nationally representative Afrobarometer surveys in each country, we find that our sample is younger, more educated, wealthier, and more urban, as other studies in Kenya and Mexico similarly find. Thus, researchers who want to recruit surveys through Facebook should keep this in mind.

When Facebook users clicked on the ad, it took them to the baseline survey hosted by Qualtrics. There, we collected respondents’ mobile phone numbers and emails. We screened their eligibility for receiving the endline based on consent, citizenship status, having a valid phone number for payment, and taking at least 9 minutes to complete the baseline survey. Using Telerivet, we sent respondents their first participation token (850 Tanzanian shillings/50 Kenyan shillings or about .60 USD) after they completed the baseline and a randomly generated date within the respective endline windows for their follow-up survey. On that date, we sent them a link to their endline survey with instructions that they had 24 hours to complete this survey. Upon completion, we sent respondents their second participation token (2550 TSH/200 KSH or about 1.20/1.90 USD). Out of 3,810 eligible baseline survey respondents, our endline attrition rate was 31%, giving us a total of 2,647 respondents.
Troubleshooting and Lessons Learned
While our online panel survey was successful, we’ve identified several changes that we’re now implementing with future panel Facebook-recruited surveys moving forward. We hope these lessons are useful to other researchers.
First, in order to publicly show ads, our Facebook page has to be public. This means that our respondents and others can comment on the page and on our ads. Usually, this was helpful, because our respondents would confirm that the survey wasn’t a scam (see photos below). But because we obviously can’t control what people post (not only inappropriate comments but revealing survey treatments for example), we always had to be “on call” to delete comments.

Relatedly, since our endline survey was staggered (not everyone received the endline on the same day), some respondents would post that they had completed their endline which would prompt confusion and lead to others asking for their endline / telling us that we missed their endline. In a few cases, their follow-up surveys were lost in their email / their phones didn’t receive the link, so we would have to check each request. This led to a lot of direct back-and-forth messaging through Facebook.
Third, although in the consent form we explicitly state that each person can only take the survey once, and we collect their email and mobile phone number to verify, some individuals tried taking the survey more than once by using another number or email. We found a handful of people doing this, because they messaged us when they didn’t receive their endline(s) at the same time as they had expected. Since they were not aware of our research design (i.e. that the endline would be staggered across two weeks), they assumed that they would receive their endline surveys under different accounts at the same time. If our survey had not been this panel design with the ability of respondents to privately message us through Facebook for help, we would not have been able to identify these repeat survey-takers.
Lastly, Qualtrics had trouble showing the survey on certain mobile phone devices / mobile providers. Affected respondents would not be able to access the survey properly, prompting many messages to us. We tried working with Qualtrics staff to get this fixed (at first they were not convinced it was an error on their side), their IT team took more than a month to fix the issue, and by then our survey period was already over. Thus, we now implement surveys directly through Facebook messenger using software including Surveybot.io and Chatfuel.
Additional Resources
For a “how to” video on creating Facebook advertisements for survey recruitment see [here] and slides [here].